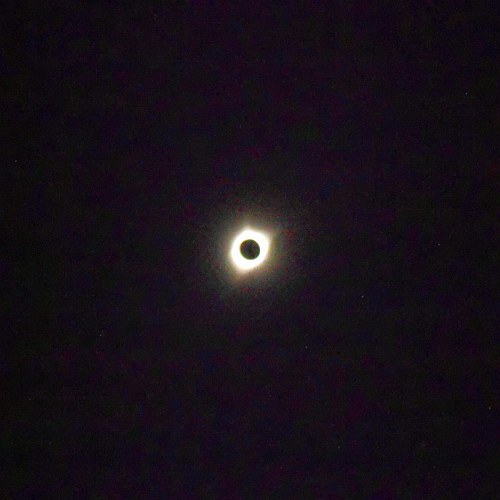
Notice the three (almost four) prominent coronal streamers.
Ok, it took me 2+ days to get back from the eclipse, catch up on my sleep (and food), unpack the car, and start to look at the data. This has been my first chance to get online and upload a few pictures.
I had an extra camera, a simple little "point-and-shoot" snapshot camera, which I wasn't otherwise going to be able to use during the eclipse, so I gave it to one of the kids with a large party from the Merced, CA, area who camped across from me. I wasn't able to collect names, but one of them took this nice shot during totality: Compare with this thumbnail photo of the
inner corona from the front page at Wikipedia 2 days later (over at the "recent news" on the righthand
side):
Compare with this thumbnail photo of the
inner corona from the front page at Wikipedia 2 days later (over at the "recent news" on the righthand
side):
This eclipse was noticeably brighter than the one 38 years ago, meaning the corona was much brighter and more spectacular. I also didn't notice any very rapidly moving shadow bands, or diffraction interference bands, just before (or after) totality this time; they were perhaps the most prominent feature of the previous eclipse, though the sight of the corona at totality is always incredible. [Years later: the best description I've run across of the shadow bands as I experienced them in 1979 is by Mike Frost (pgs 77-8) in the 2024 book Eclipse and Revelation, Henrike Lange & Tom McLeish, editors (Oxford University Press). He uses the apt term "strobe", and refers to the bands' disorienting nature on people who experience them. But I disagree with Frost about the cause. He likens the bands to the twinkling of the stars, caused by atmospheric turbulence, which is random and chaotic, whereas I think the bands are a diffraction interference effect which actually requires what a nighttime astronomer would call good seeing. Solar astronomers have long known that under fair weather conditions the best seeing is around mid-morning, when the sun has gotten up high enough in elevation that's it's not being viewed through too large an airmass, but not so high that's its heating of the air and ground have stirred the atmosphere up too much. For that reason, I'd predict the kind of shadow bands I saw would be most likely when the eclipse occurs mid-morning (plus or minus) local time.]
Continuing... Photos really can't convey or give a good impression of what it's like being there. This is probably the result of the corona having a range of brightness of at least 500x, from the faintest outermost whisps to the regions near the sun/moon's limb. The eye is able to accommodate this high a dynamic range, which is roughly 9 stops in photographer's lingo, though it's very difficult to compress into the range available with cameras and the means one might use to display the images made with them. Ansel Adams would have said the scene's brilliance is too great for the medium.
The other thing I got this time that I didn't get in 1978 was the 3-D tunnel-into-heaven effect. This is hard to describe, but the moon's dark disk looks like an opening, with the corona tapering off in brightness away from its edges giving an illusion of depth and distance into the apparent opening. I've always been amused that the people who write about the origin of religion (or at least some religions) never mention this view of eclipse totality, which I'm sure I'm not the first one to experience.
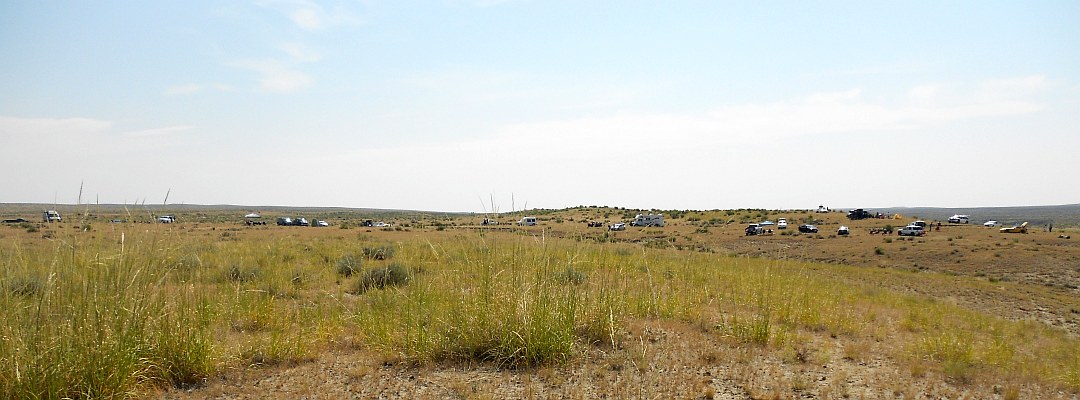
The GPS coordinates were measured as: 107° 55' 18.6" (W), +43° 11' 45.3";
5075 feet. (car @farthest right w/trunk up)
This web app output from NASA [no longer appears active] shows the relevant stats for this spot:
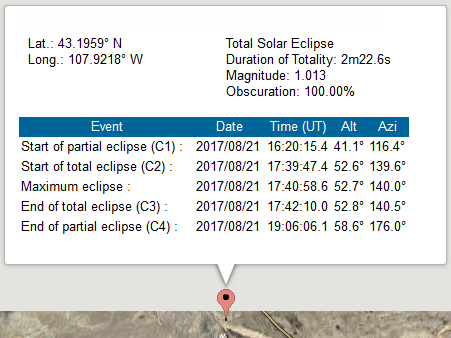
The nearest point on the centerline SSW of us (i.e., along a perpendicular from it) was 4½ miles away, but this made only a 1.4 second (1%) difference in the length of totality. The point on the centerline which had an exactly identical time of maximum eclipse was a little bit further along the track (more S-SSW from our location) and closer to 4 5/8 or 4 2/3 miles away.
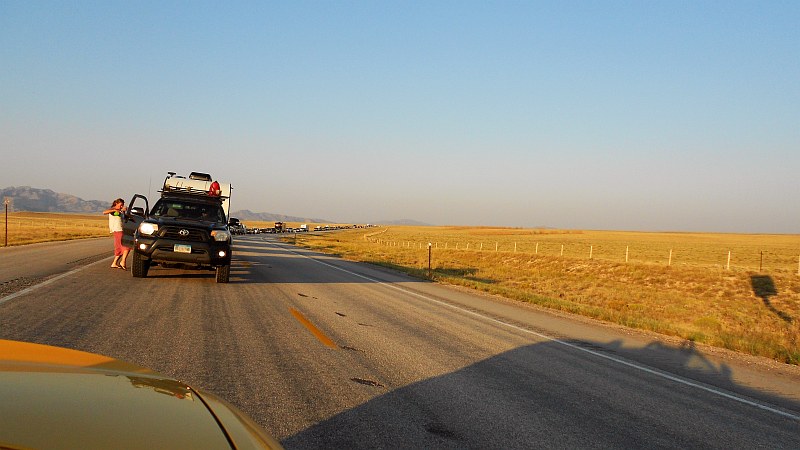
According to one source, some 600,000 people from Colorado were expected to go up to Wyoming for the eclipse, which only has about that number of people all told (CO has ~5 million) -- and most of them I actually avoided since they were heading back down I-25 from Casper to the large cities of the Front Range. Being around quite a few gas stations and at least one restaurant on the trip, I saw mostly Colorado license plates.
Also: thanks to the party from Salt Lake City camping next to me, who had extra reserves of water to share with me, since I only had two quarts. They told me about the almost 2-meter class telescope the astronomy club there was putting the finishing touches on.
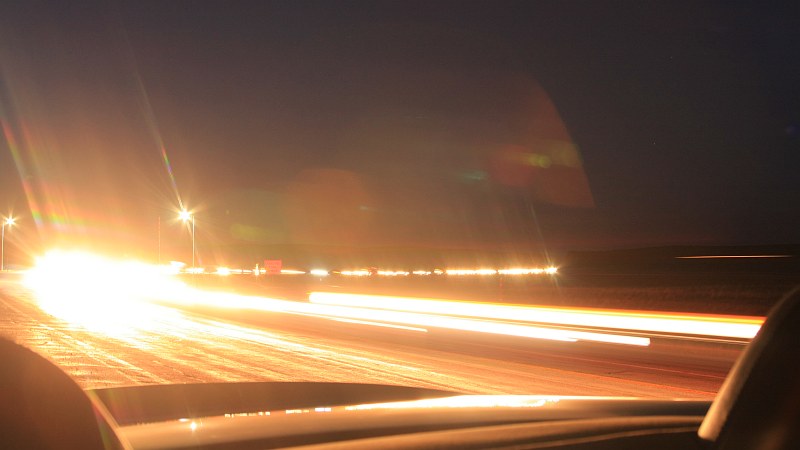
 By the time I made it to Rawlins and I-80 around
10PM the traffic had thinned sufficiently -- twice as many lanes certainly
helped also -- to be back to normal speeds. But in the long stretch of
two-lane south to I-70 at Rifle, CO, I started to get blurry-eyed in the
early AM hours and had to pull over for a several hour nap, not making
it back to Montrose until 8 AM. I quickly turned on the morning TV "news"
to catch up on what scientists were reporting about the eclipse, only to
be treated to typical celebrity crappage about what Sarah Jessica Parker
had seen in New York city, which only had a √2-1 eclipse.
Then, as if that wasn't bad enough, they had to have a zany, madcap plot
line where one of the show's hosts couldn't find her way out of the studio
and down the back stairs to get outside. OMG, she's going to be late for
the eclipse! This is criminal misuse of the public airwaves.
By the time I made it to Rawlins and I-80 around
10PM the traffic had thinned sufficiently -- twice as many lanes certainly
helped also -- to be back to normal speeds. But in the long stretch of
two-lane south to I-70 at Rifle, CO, I started to get blurry-eyed in the
early AM hours and had to pull over for a several hour nap, not making
it back to Montrose until 8 AM. I quickly turned on the morning TV "news"
to catch up on what scientists were reporting about the eclipse, only to
be treated to typical celebrity crappage about what Sarah Jessica Parker
had seen in New York city, which only had a √2-1 eclipse.
Then, as if that wasn't bad enough, they had to have a zany, madcap plot
line where one of the show's hosts couldn't find her way out of the studio
and down the back stairs to get outside. OMG, she's going to be late for
the eclipse! This is criminal misuse of the public airwaves.
More to follow...
An Eclipse Expedition of the Past
William H. Calvin (1991), How the Shaman Stole the Moon; Bantam, NY.
Don Lago (2017), Where the Sky Touched the Earth; University of Nevada Press, Reno.
Mark Littmann, Ken Willcox & Fred Espenak
(1999), Totality: Eclipses of the Sun, 2nd ed.; Oxford University Press, Oxford, UK.
Aden & Marjorie Meinel (1983), Sunsets, Twilights, and Evening Skies; Cambridge University Press, Cambridge.
Tyler Nordgren (2016), Sun Moon Earth: The History of Solar Eclipses; Basic Books, NY.
Donald E. Osterbrock (1988), Eye on the Sky; University of California Press, Berkeley.
Donald E. Osterbrock (1993), Pauper & Prince; University of Arizona Press, Tucson.
Ray A. Williamson (1984), Living the Sky; University of Oklahoma Press, Norman.
Jon Willis (2016), All These Worlds Are Yours; Yale University Press, New Haven.
GPS Coordinate Calculator - the great
circle distance app is handy to have for work with any near-spherical surface.
A Funny Thing Happened On the Way to the Eclipse
or How Getting a Place Was the Biggest Mistake I've Ever Made
For anyone who's been checking, I haven't posted anything new here since shortly after the eclipse -- as a result of being given a case of HOA Syndrome: three weeks before the eclipse, the Montrose Mafia stole my car out of my driveway, forcing me at first to think I was going to have to ride my bicycle ~400 miles to the centerline, and then later to get my collector car out of mothballs at the last minute in order to make it to the eclipse [HOA = Home Owners Association].
I get around entirely by bicycle, for four 10
years now, so them putting my now stolen and held hostage car 10 miles
away made it impossible to try and retrieve. For one thing it needed
a new battery, which weighs at least some 25-30 pounds. For another,
I'd been siphoning all the old gas out of it over the Summer (and
burning it in the BBQ), in preparation for taking it to the eclipse,
and there are no gas
 stations within about 8 miles of where they had it, so I also would
have had to bicycle down there with at least 1-2 gallons (10-15 lbs)
of gasoline. For a third, it hadn't been run for 4 years, and while
I would have expected it to start up fairly easily, in the event that
it didn't there was no auto service nearby, just like there wasn't
any gas.
stations within about 8 miles of where they had it, so I also would
have had to bicycle down there with at least 1-2 gallons (10-15 lbs)
of gasoline. For a third, it hadn't been run for 4 years, and while
I would have expected it to start up fairly easily, in the event that
it didn't there was no auto service nearby, just like there wasn't
any gas.
Not only were they expecting me to also give them nearly a kilobuck for the 'privilege' of being harassed, bullied, and robbed by the property management company's Mr. Big and his lawyers, NOW they've upped the ante and are suing me for $4.3K -- on a car that was likely worth less than a half that! It's sixteen years old, has been hit by a deer, and needed some other fixes, like for the cracked windshield it's had for 7 years.
Anyone up for starting a legal defense fund? Running
legal plunder total so far: $92 (to file an ~85 word statement
w/the court, for the equivalent of ~3 weeks worth of groceries- gah!)
Anyone know any lawyers? Anybody have a
Varon-T disruptor I can borrow? My Higgs
field enhanced model (v.2) is still under construction.
Or maybe one of you 'special-ops' types can get the GPS coordinates 38°28½'N, 107°52½W onto N. Korea's ICBM targeting list. How hard can it be to hack into their missile command and control systems? The sooner this hellhole of criminals, barbarians, and morons is obliterated, the better. Being dumbshit criminal scum, lawyers, and other barbarians they're too stupid to know they shouldn't eff-over and destroy the life's work of someone who can and will destroy them.

Other material on the HOA Syndrome.
Skip to where this sordid story picks up down below.
On top of that, MicroSoft dumped an "update" on me two or three
weeks after the eclipse, and now my programming environment no longer
works worked. I was right in the middle of writing
some code to do some calculations and make some graphs, but attempts
to figure out what went wrong and how to fix it have been to no avail...
Well, it must have been some obscure compiler glitch, because
switching a few lines of code around, which shouldn't have made any
difference at all, made the bug go away. So here are the graphs:
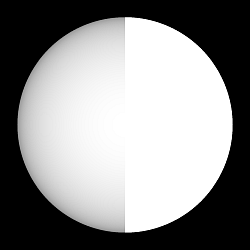
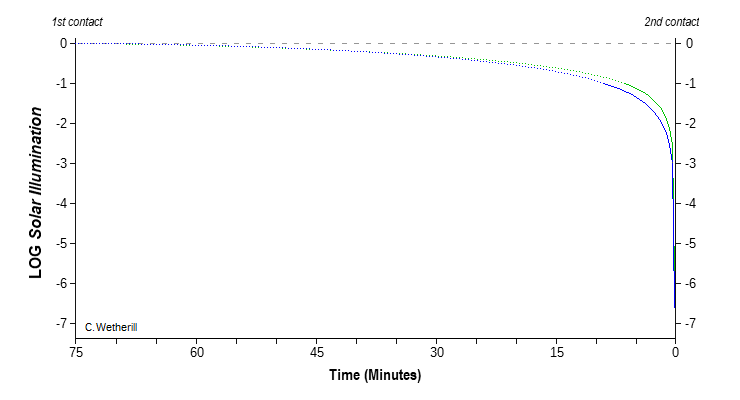
 The blue curve shows the illumination level
fall-off for a synthetic, computer generated, limb darkened sun
(at left/left), using the simple empirical relationship in
Hestroffer & Magnan (1997) -- their Eq. 1,
with the parameter values for u and α from the caption to
Fig. 2. As their reference wavelength is λ = 579.88 nm,
this model may underestimate the actual visual (λ = 555
nm) limb darkening very slightly, because of its wavelength
dependence, being less at longer ones. For those using other
limb darkening models, the sun I generate is 75.7% the
brightness of a uniform disk -- the green curve, which crosses
above the blue one at T = 41:35 (m:s). Each curve is normalized
to its own unobstructed (total) level so this difference doesn't
show in the graph.
The blue curve shows the illumination level
fall-off for a synthetic, computer generated, limb darkened sun
(at left/left), using the simple empirical relationship in
Hestroffer & Magnan (1997) -- their Eq. 1,
with the parameter values for u and α from the caption to
Fig. 2. As their reference wavelength is λ = 579.88 nm,
this model may underestimate the actual visual (λ = 555
nm) limb darkening very slightly, because of its wavelength
dependence, being less at longer ones. For those using other
limb darkening models, the sun I generate is 75.7% the
brightness of a uniform disk -- the green curve, which crosses
above the blue one at T = 41:35 (m:s). Each curve is normalized
to its own unobstructed (total) level so this difference doesn't
show in the graph.
The Eclipse in Color
I revisted this simple (monochrome) solar limb darkened eclipse model some 10 months later, motivated by Ronald Bruns' work, described in the panel at the bottom of pgs 24-5 in the August, 2018, issue of Sky & Telescope magazine. He tried to measure the change in sky color at several angles from the sun ( 5°, 15°, and 25°) during the part of the eclipse ±8 minutes on either side of totality. The atmosphere acts as a constant light scatterer, so any change in its color would be due to a change in the color of the eclipsed sun illuminating it.

Because the limb darkened sun appears to have different (lower) temperatures at greater angles from the center of the disk, it also has different (redder) colors at these larger radii. We would thus expect the color of the sun's illumination, and thus the color of the sky also, to change during an eclipse, in the sense of getting redder. Bruns reports seeing a "a small increase in redness as the eclipse progressed".
If the last arc-minute or two of the limb of the sun still visible just before second contact is dimmer by ~½, then, according to the Stefan's Law (L~T4), it is also cooler by a factor of ~½¼ = 0.84x relative to its temperature at the disk's center, which is where the temperature is at a maximum.
The value of this temperature is determined by requiring the effective temperature integrated over the entire (uneclipsed) disk to equal the well known textbook value going back decades of 5770°K.
Using synthetic blackbody spectra generated over the visual spectrum (λλ=350-720nm, Δλ=10nm), the value of the temperature at the center of the sun's disk needs to be T0 = 6125°K for the integrated color to come out Teff = 5770°K with my limb darkening model.
Even though the regions at greater radii from the center of the disk have greater net area, they're also dimmer, so they contribute less on that count, and more of the total light comes from the slightly hotter regions of the disk nearer the center.
The spectrum integrated over the entire disk is the sum of a large number of blackbody spectra (one for each synthetic pixel in the computer program, of which there are 785,000+) spanning a range of temperatures from T0 down to below 4000°K -- 3815°K at the extreme edge of the disk, though this minimum value is somewhat superfluous since it depends on the chosen pixel resolution, which was set arbitrarily at 1.8 arc-seconds, or ~700 km on the sun.
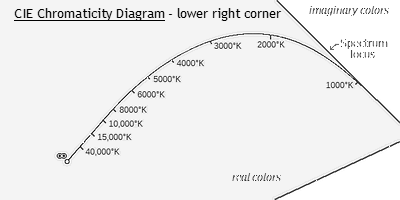 The net, integrated spectrum could be described as a blackbody spectrum
"smeared out" (or broadened) in wavelength slightly. It's rather remarkable
that it's visual, CIE chromaticity coordinates are virtually indistinguishable
from a simple blackbody with a single temperature, maybe ±6-8°K
different when expressed in that fashion. The CIE chromaticity coordinates
only differ from those of a pure blackbody by about 0.0001 in both x
and y. For those familiar with the locus of Planckian radiators in
the standard CIE chromaticity diagram (at right), the spectra integrated
over the sun's disk lie just 'inside' or on the concave side of this line,
practically touching it; at the resolution of computer graphics the distance
from the line is less than the thickness of the line. Another way to look at
it is the smearing out causes the summation spectrum to look like a blackbody
spectrum with its peak leveled off some, which makes it slightly deficient
in generally the greenish wavelengths at these temperatures, compared to a
blackbody spectrum itself. Hence the small shift in the other direction from
green in the chromaticity diagram away from the blackbody locus. The other
way to understand this is that the sum of any two illuminants has chromaticity
coordinates in between the coordinates of the two sources; since the locus
of Planckian radiators in the chromaticity diagram is concave, the sum of
a bunch of such radiators of similar temperatures is necessarily going to
be below the locus.
The net, integrated spectrum could be described as a blackbody spectrum
"smeared out" (or broadened) in wavelength slightly. It's rather remarkable
that it's visual, CIE chromaticity coordinates are virtually indistinguishable
from a simple blackbody with a single temperature, maybe ±6-8°K
different when expressed in that fashion. The CIE chromaticity coordinates
only differ from those of a pure blackbody by about 0.0001 in both x
and y. For those familiar with the locus of Planckian radiators in
the standard CIE chromaticity diagram (at right), the spectra integrated
over the sun's disk lie just 'inside' or on the concave side of this line,
practically touching it; at the resolution of computer graphics the distance
from the line is less than the thickness of the line. Another way to look at
it is the smearing out causes the summation spectrum to look like a blackbody
spectrum with its peak leveled off some, which makes it slightly deficient
in generally the greenish wavelengths at these temperatures, compared to a
blackbody spectrum itself. Hence the small shift in the other direction from
green in the chromaticity diagram away from the blackbody locus. The other
way to understand this is that the sum of any two illuminants has chromaticity
coordinates in between the coordinates of the two sources; since the locus
of Planckian radiators in the chromaticity diagram is concave, the sum of
a bunch of such radiators of similar temperatures is necessarily going to
be below the locus.
What happens after first contact is the integrated color first becomes slightly bluer and hotter, because the moon is covering up parts of the cooler, redder, more heavily limb darkened areas of the sun near the contact point. About 20 minutes after first contact, the effective temperature of the integrated light from the sun reaches a maximum Tmax ≈ 5795°K before reversing and coming back down. At this point, the overall light level is only down ~14% (0.065 in the Log, or a little more than 1/5th 'stop' photographically) from its uneclipsed level.
By some 34 minutes after first contact it has come full circle back to Teff = 5770°K, after which it then continues to get cooler and redder, as the central, hotter and bluer parts of the sun near the center of the disk get eclipsed. The light level at this point is down a little more than a third (34½%), 0.18 in the Log, or 0.6 photo stops. Again, these numbers are using my 'generic eclipse' timescale and limb darkening model.
The drop in Teff for the integrated light, and the accompanying change in color towards the red, then continues all the way to second contact. With fifteen minutes to go before totality, Teff has dropped to ~5500°K. By then the changes are accelerating, so that with ten minutes to go Teff = 5345-50°K, with five minutes to go it's dropped to 5105-10°K (which is roughly 0.84*T0), and with just 1½ minutes before second contact Teff has dropped all the way to 4740-45°K. This run is nicely summarized in the graph of Teff versus Time:
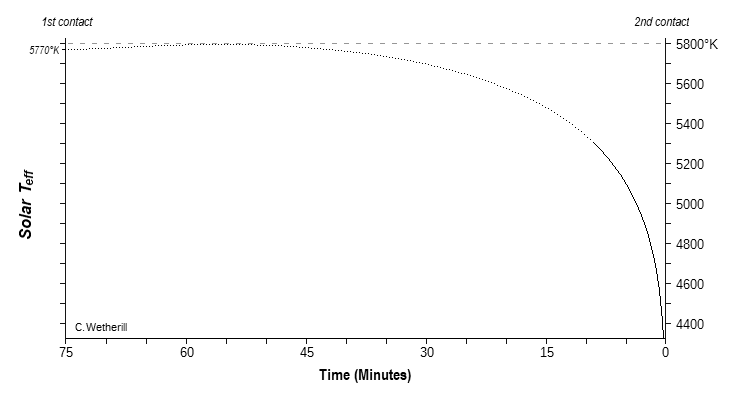
This big drop in the color temperature of the eclipsed sun no doubt accounts for the general sunset-y and twilight-y ambience of the lighting in the minutes before (and after) totality that makes such events so unusual and unique. As before, in the last ~1 minute or 100 seconds before second contact the light from the corona starts to significantly contribute to the total, so it's difficult to say exactly how Teff behaves then, since the brightness of the corona is going to vary from eclipse to eclipse.
Now, back to what Bruns was trying to do... First, he was making measures using standard astronomical B (blue) and V ("visual", or mostly green) filters. So I used generic Johnson B and V sensitivities, taken from Malin & Murdin (The Colours of the Stars, 1984, diagram top of p.7), and ran blackbody spectra with various Teff's through them to get B-V color indices.
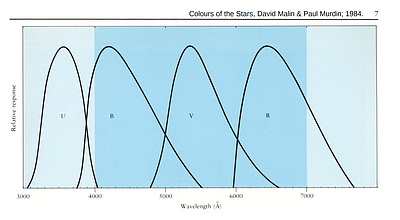
[Because Malin & Murdin's curves (at right) were shown as all having the
same peak height, they first had to be normalized, according to standard
astronomical procedure, to give m=0 for each channel for a spectrum like
that of Vega. I did this using a pure blackbody spectrum with T =
12,500°K as an approximation to Vega.
This gives, for Teff = 5770°K, a color of B-V = 0.60 for the
uneclipsed sun. While this is a little lower that the actual, measured,
textbook value of 0.65-0.67, this seems reasonable for pure blackbody spectra
when the effects of the line-blanketing present in real stellar spectra are
qualitatively taken into account: These are relatively insignificant for
Vega's spectrum at the wavelengths under consideration, barely effecting the
B channel (and the V channel not at all), while for a spectrum like the sun's
they will effect the B channel more than the V channel, making the B magnitude
dimmer, and thus higher numerically, increasing B-V. An amount of ~0.06
magnitudes seems plausible for this effect, though I can offer nothing more
substantive to support this other than that it is roughly typical of the size
of the B-V component of the line blanketing vectors one sees in color-color
diagrams for model stellar atmospheres in the literature when one goes from
virtually zero 'metal' abundance (the main cause of the blanketing for solar
type stars), where the spectrum is going to most closely resemble a pure
blackbody, to a model star with solar metal abundance.
A slightly larger amount of line-blanketing correction would justify using
a lower temperature for the normalization spectrum, which would yield a lower
B-V color for Teff = 5770°K by several hundreths of a magnitude.
The 12,500°K value is settled on partly because it gives a nice round
number for the resulting B-V corresponding to Teff for the
uneclipsed sun.]
So with the above calibration procedures, I get the following run of B-V versus time for my model eclipse:
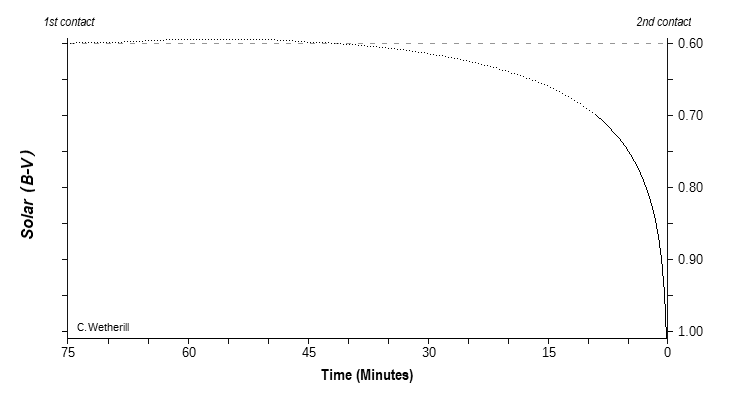
In the last 7½-8 minutes before second contact one should see an increase in B-V of ~¼ magnitudes or more.
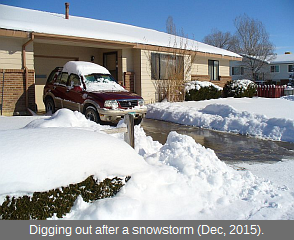
When scattering the eclipsed sun's light off the atmosphere, the resulting color will be offset in B-V by a constant amount relative to what it would be if the measure was instead being taken off a spectrally neutral reflector, like a white card (or snow covered ground) which was shielded so as to be contaminated by as little (bluish) sky light as possible.
What's the amount of this offset? I.e., what's B-V for the regular blue sky? I came up with B-V = -0.310, using a pure λ-4 Rayleigh scattering function and satellite measures for the spectrum of the sun above the atmosphere as the illuminant. This blue sky color has CIE chromaticity coordinates of (x,y) = 0.2343, 0.2343. (Yes, x=y. It's not a typo.)
The sunlight making it through this scattering is dimmed by 0.193 magnitudes in the CIE visual luminosity channel (Y), which is very roughly the same as Johnson V -- or at least that was the original idea behind the latter. So 0.20 magnitudes is roughly the amount of extinction due to one air mass of perfectly clean and dry air, which seems reasonable.
This above-the-atmosphere solar spectrum has CIE chromaticity coordinates
of (x,y) = 0.3234, 0.3327 and Teff = 5952°K.
After making it to the ground, the spectrum is then at (x,y) = 0.3503,
0.3623 in the CIE chromaticity diagram, which has a color temperature
of about 4700°K. After so much of the blue light has been removed
(scattered out to make the sky blue) it is farther from the locus of
blackbodies in the CIE chromaticity diagram than the composite, smeared
out spectra from above.
This serves to emphasize that my calculated graph of Teff
during an eclipse gives above-the-atmosphere values and would need to
be corrected for local atmospheric extinction (absorption) before
comparing them with on-the-ground measurements.
Now, "daylight" on the ground is a mixture of such filtered sunlight and the bluish light of the sky. When the latter is 1/6th of the total, the mixture's CIE chromaticity coordinates are (x,y) = 0.3310, 0.3410, which is above (on the convex side of) the locus of Planckian radiators; at 5550°K it corresponds to the color temperature of photographic daylight. So all this makes sense.
The only loose end in the above jigsaw puzzle is the Teff = 5952°K value for the above-the-atmosphere solar spectrum, which is almost 200°K higher than the 5770°K canonical value. One would suppose that the line-blanketing present in the real, measured spectrum compared to an ideal blackbocy spectrum would move Teff in the other direction -- or give the correct value. So I'm not sure exactly what's going on here, especially since everything else seems to fit.
The second thing Bruns was trying to detect was an increase in the blueness of the sky just before totality. Edmund Halley had reportedly seen such a thing at the May 3, 1715, eclipse. Bruns reports his measures in the B channel increased by some 5% in the seconds before totality. This gets into the zone of time where my simple eclipse model becomes untrustworthy because it can't include the light from the corona.
While I would at first maybe be inclined to take Halley's report as being an artifact of the human color vision system, since the light levels are dropping faster then than the eye can adapt, and the illumination levels are in the zone where both photopic (day/color) and scoptopic (night) vision are active, leading to weird interaction effects, Bruns' measures could simply be due to the bluer corona overwhelming the quite reddish light from the tiny sliver of sun still visible in the last seconds before second contact. As always, more research (and funding!) is called for.
Continuing, from way back higher up...
And then, barely a week after getting back from the eclipse, there was the 8th-9th magnitude Asteroid 3122 Florence flying by close to the earth; it won't be back for several hundred years. I got 5 hours of great observations (some 700+ frames), and have been assembling a time-lapse movie when I get a chance.
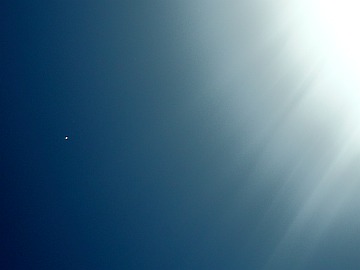
But I did get some excellent results for the eclipse, like a picture during totality showing Regulus in the frame (a section of which is shown at right), which I haven't seen anywhere else. My focal length was chosen with doing this very thing in mind. I also haven't heard of anyone noticing it visually during the eclipse. Everyone I talked with beforehand was looking to see planets during totality. [Actually, I finally saw such a shot, in late April, 2018. It went by on the local TV news very quickly, so I don't know it's source. There was no credit pasted onto the photo. It was shown as part of a voice-overed promo for an upcoming segment and was not shown again during the piece itself.]
Because Regulus is so near the ecliptic, eclipses in its vicinity are semi-frequent, and they will always occur at about this same time of year. The last one before this was August 21, 1914. Totality lasted 2m14s max, and the track went from N Canada to Greenland, across Scandanavia and E Russia (Minsk, Kiev), before angling more SE to N Iraq and Persia. Before that it had been two centuries: 24 August, 1710, when totality visible in S America lasted 4m00s. In between now and then there had been half a dozen annular eclipses ±3 days of August 23rd, with none in the entire 19th century. There will be three more total eclipses within just ±1 day before the end of this century: in 2044, 2063, and 2082.
 This view is in an Alt-Az orientation; Regulus was actually ~½
arc-minute N of the Sun in equatorial/celestial coordinates then (39
arc-seconds). The ecliptic goes below Regulus. It was 1.3°
from the center of the Sun, or almost 5 (4.96) solar radii
(Rο). The outermost coronal streamers seen here hit the
frame edge at a little less than 4½ (4.45) Rο. At
shorter exposure levels all the streamers go straight in to 1
Rο, so they're almost more in the way of jets emanating
from the surface (photosphere or chromosphere).
This view is in an Alt-Az orientation; Regulus was actually ~½
arc-minute N of the Sun in equatorial/celestial coordinates then (39
arc-seconds). The ecliptic goes below Regulus. It was 1.3°
from the center of the Sun, or almost 5 (4.96) solar radii
(Rο). The outermost coronal streamers seen here hit the
frame edge at a little less than 4½ (4.45) Rο. At
shorter exposure levels all the streamers go straight in to 1
Rο, so they're almost more in the way of jets emanating
from the surface (photosphere or chromosphere).
When I got around (almost a year later) to integrating the Alt/Az
field rotation rate equation, from the time of observation to the
meridian, I got a total field rotation amount of 28½°
(28.46). So celestial N is almost in the 11 o'clock direction
(which would be 30°).
(While the roughly 1 hour of field rotation from the time of observation
to the local meridian might seem less than the roughly 1½hr
hour angle, it's actually the other way around -- because astronomers use
a 24 hour clock; so there's a missing factor of two when switching to a
civil clock face. The field rotation rate for an object near the celestial
equator is actually at a maximum while it transits the meridian, and, more
importantly, therefore greater than its mean rate; concommitantly, the
field rotation rate is at a minimum when the azimuth is due E or W rather
than S.)
[It took 575 lines of computer code -- though I use a lot of comments. As is typical for such a project, the integration (numerical summation) itself only takes ~20 lines, while the rest gets everything set up to perform it.
Besides the observer's geographical coordinates and the object's celestial
coordinates, the date and time of observation are also needed. The date
is used to determine the Julian Day Number, which is used with the local
clock time (Time Zone time) and the observer's longitude to perform the
 transformation into Local Sidereal Time. This gives the all important Hour
Angle. Then with all these in hand one can calculate the Altitude, Azimuth,
and Field Rotation Rate. With an Hour Angle of ~1½ hrs I decided to break
the integration down to ~5500 one second steps.
transformation into Local Sidereal Time. This gives the all important Hour
Angle. Then with all these in hand one can calculate the Altitude, Azimuth,
and Field Rotation Rate. With an Hour Angle of ~1½ hrs I decided to break
the integration down to ~5500 one second steps.
The speed of modern computers is completely astounding: when Duffett-Smith wrote Astronomy With Your Personal Computer (1985), calculating a sine or cosine was so computationally expensive (slow) that he used the old trick of only calculating any trigonometric function once and then storing the result in a variable, which is much quicker to access or retrieve when needed. Each step in the field rotation rate integration involves the calculation of about 15 trig functions in getting the Altitude, Azimuth, and Field Rotation Rate, or almost 100,000 in all with my step size. But it happens instaneously to all appearances when I hit <CR>. In fact, expecting there to be a pause (and maybe a long one), when I first ran the code I thought it must somehow be skipping the integration loop because it came back so fast -- except that it was giving the same result (28 5/8°) as I'd gotten from measuring the angles between the few other stars visible besides Regulus (see next).
BTW - There's a minor bug in a popular document which might trip people
up a little who try doing this at home... if you do a search on keywords
like "Altitude Azimuth Mount Field Rotation" you may easily turn up a PDF
file by Bill Keicher, dated 12 March 2005. The title of this research paper
is Field Rotation in Altitude over Azimuth Mounts and Its Effects on CCD
Imaging -- What is the Maximum Exposure?. My copy of the paper has the
filename Field Rotation
V3.pdf. The problem is in Appendix A (Mathematics of Field Rotation
in an Alt/Az Mount), pg 13. There we find the equation for the field
rotation rate, and the constant W:
W = 4.178E-03 Earth rotation in degrees/sidereal second (emphasis
mine)
 The problem is that this is the rate in degrees per solar second,
not per sidereal second. In sidereal seconds the coefficient is 4.16666...
(1/240) rather than 4.178. (The exponent stays the same.) Any field will
rotate once all the way around (360°) in a sidereal day; since
a sidereal day is shorter than a solar day, a solar second is longer
than a sidereal second, and the rate constant is higher when
using solar seconds. Work it out for and convince yourself that you
want to use the slightly smaller value when integrating over a change
in Hour Angle, since this is based on Local Sidereal Time.]
The problem is that this is the rate in degrees per solar second,
not per sidereal second. In sidereal seconds the coefficient is 4.16666...
(1/240) rather than 4.178. (The exponent stays the same.) Any field will
rotate once all the way around (360°) in a sidereal day; since
a sidereal day is shorter than a solar day, a solar second is longer
than a sidereal second, and the rate constant is higher when
using solar seconds. Work it out for and convince yourself that you
want to use the slightly smaller value when integrating over a change
in Hour Angle, since this is based on Local Sidereal Time.]
There are two 7th magnitude stars in the field near Regulus. In this orientation, one (HD 87647 / SAO 98949, 7.35 mag) is ~1° almost directly above Regulus, while the other (HD 87271 / SAO 98931, 7.10 mag) is almost the same amount directly to its right. The latter star is lost in the bright coronal streamer near the right edge of this crop, but the other is easily visible (if on the faint side) in the original frame above what's shown here.
[An approximation exists for the conversion between Naked Eye
Limiting Magnitude (NELM) and sky brightness in Magnitudes Per Square
Arc-Second (MPSAS), courtesy of
K. Fisher. Unfortunately his chart only goes as
bright as MPSAS=16, where the NELM=2.2, which is about a magnitude
fainter than Regulus (1½). While I had aspirations of measuring
 the sky brightness directly during totality (with a meter), I wasn't
able to do so (not enough hands), though post-eclipse estimations and
test/calibration exposures during twilight ~25 minutes before sunrise
put it closer to 13½-14. Extrapolating Fisher's relationship to
this level puts NELM at -0.2 to +0.3, which is too bright by at least
a magnitude to have allowed Regulus to have been seen, especially so
close to the bright corona, perhaps explaining the observations (or
lack thereof). Mars, at mag 1.9, 8¼° above and to the right
of the eclipse, also should have been beyond apprehension, but more
distant Venus (34°), at -3¾ below Gemini should have been
easily visible. After doing the above I found this nifty and handy
NELM / MPSAS Conversion Calculator, which
gives the same results.]
the sky brightness directly during totality (with a meter), I wasn't
able to do so (not enough hands), though post-eclipse estimations and
test/calibration exposures during twilight ~25 minutes before sunrise
put it closer to 13½-14. Extrapolating Fisher's relationship to
this level puts NELM at -0.2 to +0.3, which is too bright by at least
a magnitude to have allowed Regulus to have been seen, especially so
close to the bright corona, perhaps explaining the observations (or
lack thereof). Mars, at mag 1.9, 8¼° above and to the right
of the eclipse, also should have been beyond apprehension, but more
distant Venus (34°), at -3¾ below Gemini should have been
easily visible. After doing the above I found this nifty and handy
NELM / MPSAS Conversion Calculator, which
gives the same results.]
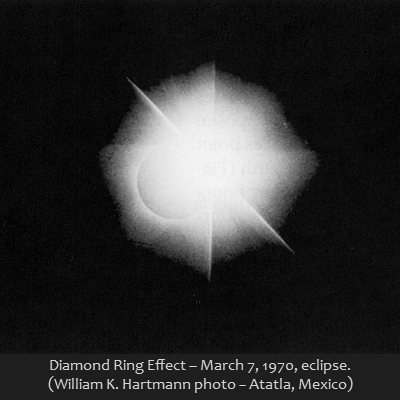
I also got a great sequence of the Diamond Ring effect (photo at right), and, more importantly, a good timing of its duration accurate to ±½ second or better, something else I haven't seen anywhere else before. This in turn gives a measure of the physical depth of the canyon on the limb of the moon responsible for it. Before releasing the figure I wanted to make a survey of peoples' subjective determination of the effect's length, to compare "eclipse time" with the hard and fast measure from an unaffected clock.
Still confused about the car? Yes, you should be. What happened was I parked it as I always did in my driveway. Then I took to my bicycle. No problemo. There the car sat for 1, 2, 3, 4, .... 46, 47, 48, 49 months. I cleared the snow off it when needed, pumped up the tires when they started to look a little low, etc. (The relevant legal concept here is called "Acquiescence" or "Course of Conduct".)
Evidently 50 months was one too many, as Mr. Big then declared my car "abandoned" -- by having a hoakey "notice" (printed on bright red paper, to look important or official, or something) taped onto the windshield. The basis for this was that the registration tags on the car were expired (not one, two, or three years, but four), something which could only have been determined by someone trespassing onto my side of the invisible three-foot property line around my house, as I always back a car in when parking, so the license plate was up against the garage door.
There was supposedly a way to contest the notice to the Property Theft Mgmt company, which I did by explaining I was in fact going to get the car registered within about another two months in order to drive it to the eclipse (which was also why I held on to the car rather than sell it). What possible difference could 51 months vs. 49 months and a 1 square inch little sticker make to anyone with half a brain left? Not much, so obviously this made little impression. Then the threatening and harassing letters from the lawyers started, followed by them sending their thugs to tow the car away. One threatened to "call the sheriff" when I protested, which I probably should have encouraged him more to do, while the other one was just muscle who didn't say anything. Strongarm didn't bother to show up himself.

As Mr. Big had been over here practically ranting at me about how he was going to foreclose on (read: steal) my home -- which made no sense since I have no mortgage (the place is fully paid for) -- this ought to eventually make an interesting test case for Colorado's "Make My Day!" law. The last scum lawyer that screwed me over got investigated by the FBI and did several (4?) years in Leavenworth, so someone ought to warn them off.
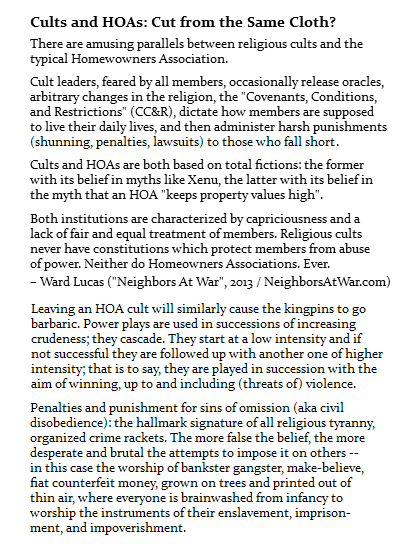
A copy of a letter I sent to my HOA neighbors has another choice Ward Lucas quote in it. He's the only person ever to have cooked up a batch of chili with a solar oven during the two hour stretch of a total eclipse from first to fourth contact!

The previous HOA president replied to my letter, starting out, in typical cult-like, Nazi-esque fashion, by lecturing me on "how we must all follow the rules, like it or not". Like H.L. Mencken said, in his typically acerbic and facetious manner, "the goosestep is the perfect symbol of 'civilization'."
What kind of horrible, deranged barbarians and desperate
criminals rob, handcuff, and gulag an astronomer?!?
The ones in Montrose!
The Tyson Effect? (On the Immiscibility of Lie-yers & Astrophysicists)

©2017-22, Chris Wetherill. All rights reserved. Display of words or photos here does NOT constitute or imply permission to store, copy, republish, or redistribute my work in any manner for any purpose without expressed prior permission.